


special EAEA
 |
|
 |
ARCHITECTURE AND MODERN INFORMATION TECHNOLOGIES
МЕЖДУНАРОДНЫЙ ЭЛЕКТРОННЫЙ НАУЧНО-ОБРАЗОВАТЕЛЬНЫЙ ЖУРНАЛ ПО НАУЧНО-ТЕХНИЧЕСКИМ И УЧЕБНО-МЕТОДИЧЕСКИМ АСПЕКТАМ СОВРЕМЕННОГО АРХИТЕКТУРНОГО ОБРАЗОВАНИЯ И ПРОЕКТИРОВАНИЯ С ИСПОЛЬЗОВАНИЕМ ВИДЕО И КОМПЬЮТЕРНЫХ ТЕХНОЛОГИЙ
GOOGLIZED CONTEXTUAL DESIGN
Martijn Stellingwerff
TU Delft, The Netherlands
Keywords: Contextual Design, Web 2.0, Geotagging, Virtual Context
Introduction
The study, development and use of Virtual Contexts (Stellingwerff, PhD Thesis, Delft, 2005) is relevant for today’s complex urban design tasks. Having a detailed contextual model at hand in the design office facilitates the searching for a ‘good fit’ for a new design within an already existing, built urban fabric.
Over the past decade, the topic of city modelling has been extensively discussed in focus-groups during meetings of the EAEA and eCAADe conferences, amongst others. Many attempts have been made to specify what information should be included, how the relevant information should be represented and how the models should be viewed and considered. Digital and physical models for urban representation share particular, similar properties, but also have distinct advantages. Digital models qualify for adaptability and ability to be shared in both a-synchronous and synchronous ways. Physical scale models excel in tangibility, directness and the ways in which they can be shared in a ‘natural’ way. Recent studies have focused on mixing the advantages of both types of representational models. Digital models can be made ‘physical’ by means of a 3D colour printer or other Rapid Prototyping techniques. Physical models can be augmented by projecting different digital data and images on them. Furthermore all kinds of post-production media can be used to refine, represent and share the model image.
A recurring problem when making contextual models, digital as well as physical, is the job to collect the right basic information, such as maps, object shapes and textures. Recent developments in photogrammetry and high resolution scanning techniques (based on aerial and terrestrial satellite images, 3D laser scans and close range façade images) offer new opportunities for the automatic generation of height maps and 3D digital façade-models. However, accuracy of collected data comes with a price and the best 3D contextual models often remain the property of local and regional municipalities and governments.
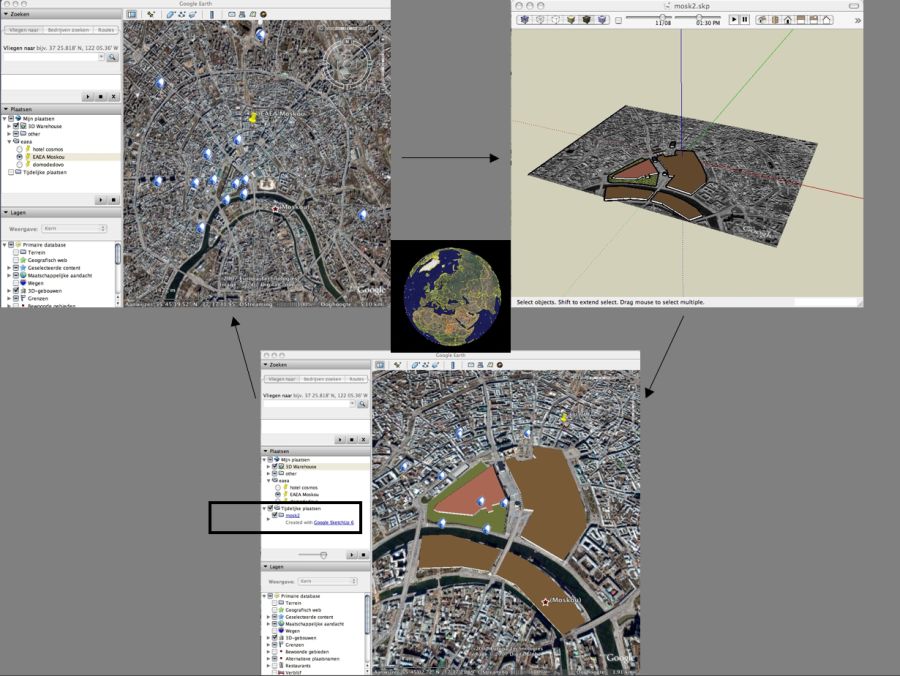
The study, which is partially presented in this paper, attempted to bypass the costly ‘high-end’ models by testing if sufficient contextual models could be made on the basis of freely available information and freely available software. Several modelling tests were performed on the basis of data from Google Earth, combined with eye-level photos from the Internet and from a site visit. The models were made by means of the freely available Google Sketch Up modeller. Focus in this paper is limited to an example that shows the collection of context information for the EAEA conference venue.
Furthermore, new Web 2.0 applications that relate to contextual information have been investigated. The new applications, available on the Internet, allow people to Share-IN-Sight in unprecedented ways.
Case Study – Imagining the surroundings of the Moscow Institute of Architecture
I have visited Moscow twice; first in 1988 and again in 1995. The regime change from Soviet to Russian, in between my two visits, was to me most recognisable in the change of city percept in the streets. The new layer of commercial advertisement that was added to the façades of shops made a totally new impression.
During the first visit, I have been briefly at the Moscow Institute of Architecture (MARKHI). I remember a view into a classroom where student work for form-studies was on display. It was interesting to see differences and resemblances, compared to the form-studies from students in Delft.
From the MARKHI building, I remember a canteen at the left side of the entrance. The room was crowded with students, and in my memory the room was a few steps down. The area in front of the school had benches and the street in front of the school gate had a kiosk.
As a preparation for my third trip to Moscow for this EAEA conference, I tried to do some ‘detective work’: I searched for images of MARKHI available on the Internet and tried to understand more about the schools’ neighbourhood by using the Google Earth globe (Fig. 1 - 4).
|
|
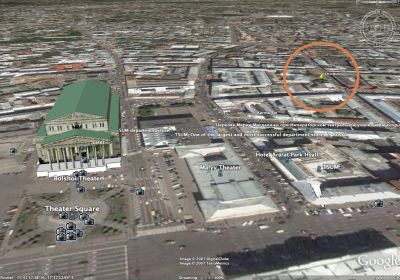
Fig. 1. Going from the Bolshoy Theatre to MARKHI. In bird’s eye perspective view, you can visually relate urban landmarks to the place where you want to go to |
|
|
|
Fig. 2. The façade of the conference venue MARKHI at night and in the past. Important historical façades can be found as linked pictures on the Google Earth map |
|
|
|
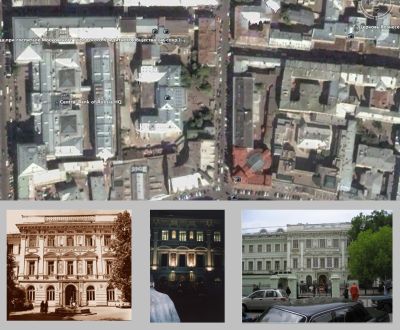
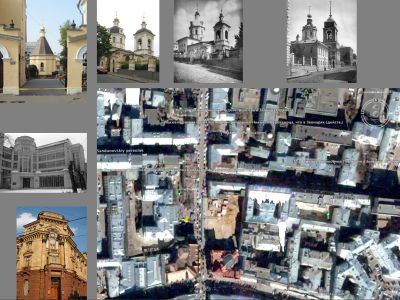
Fig. 3. Before you visit the actual place, you can explore the virtual urban context in aerial and eye-level pictures. This is the MARKHI context with some neighbour buildings |
|
|
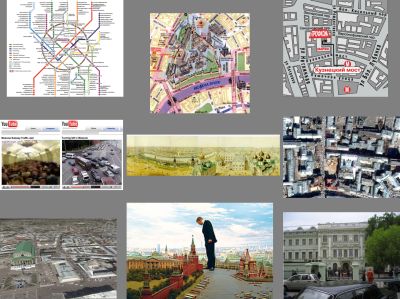
| Fig. 4. If you want to prepare yourself for a visit to a city far from home, there are many different city representations available online, ranging from schematic to romantic. Here from left to right, top to bottom: abstract Metro-plan, semi 3D-map, abstract directions, YouTube films about the overwhelming crowds in the metro and on the streets, a Kremlin panorama, aerial picture, 3D model on top of a 2D perspective aerial picture, scale model with painted panorama background, picture of the MARKHI façade. |
These visually rich experiences, from a quick search on the Internet, could not be anticipated when we met during previous EAEA conferences. The focus of the EAEA group is still the same, but the possibilities are much broader and the topic of city information and architectural visualisation has become much more wide spread. For example, both my parents and their grandchildren use Google Earth to check the sites of their next holiday destinations.
Web 2.0 applications (for architects)
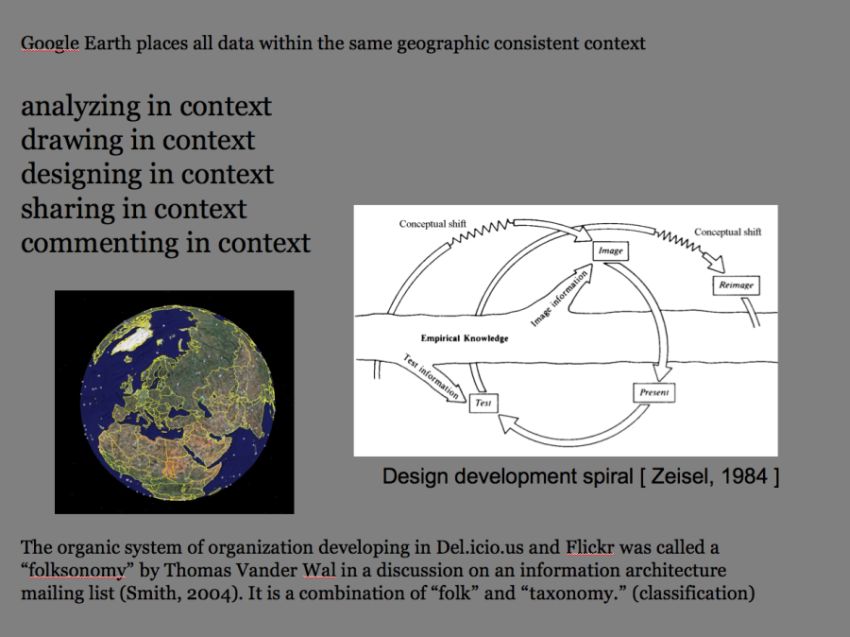
Google-Earth is only one of the new Web applications that allow us to exchange, search, tag, discuss and comment information over the Internet. A characteristic of many new web applications is the way the information is structured by the shared labour of many users. Most Web 2.0 applications cleverly try to let us do some ‘mutually beneficial globally distributed hobby work’.
We all take pictures and many of us like to publish to ‘community photo collections’ and relate those pictures to their geographic origin: this is called ‘geo-tagging’ and can be done with e.g. Flickr.com.
Many of us (but still a fortunate fraction of the 6.6 billion people) also like to make lists of interesting things, and we can share those bookmark-lists with others by using http://del.icio.us/. This is called ‘social bookmarking’.
Some of us like to model anything, and we start to model our own house and put it (still free-standing in it’s virtual neighbourhood) on Google Earth. We make 3D models of many objects and share them e.g. on http://sketchup.google.com/3dwarehouse. People are forming groups that collaboratively build city models.
Another big number of people make clips with their cell-phones and they immediately ‘broadcast’ their cinematic masterpieces to YouTube. These developments all come as massive trends and they range in their content from cooking to cars and from strange collections to strange behaviours. The overwhelming amount of data, that we collectively produce, might seem over the top and therefore un-usable, but the power of search engines combined with index-tags and geo-tags brings structure in the content-borsch.
|
| |
|
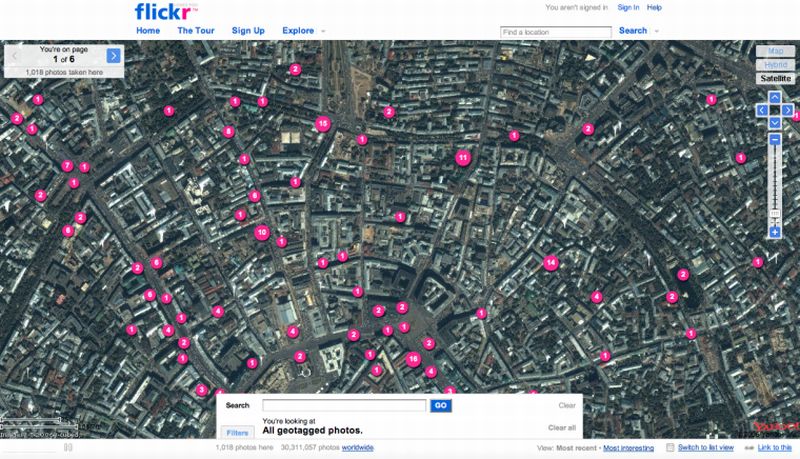
Fig. 5. Geotagged images on a Flickr-map of Moskow | |
|
| |
|
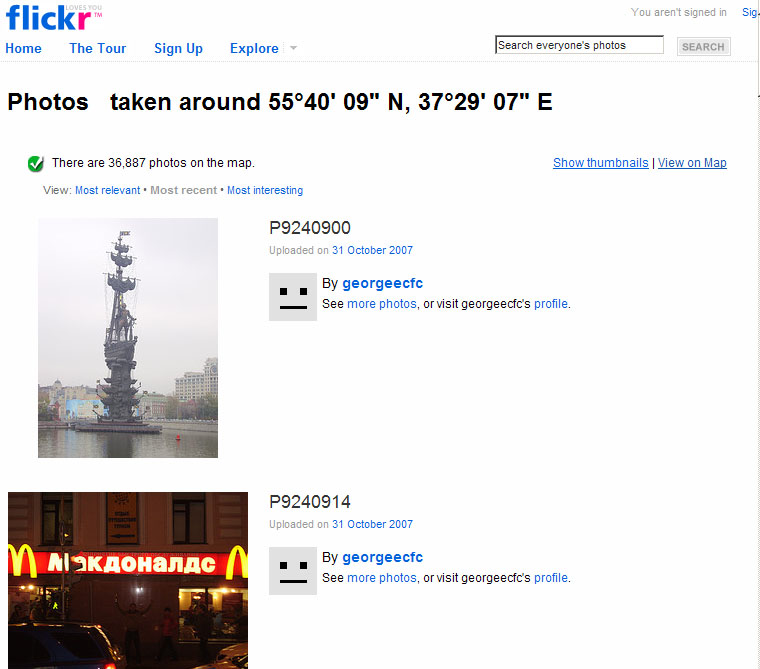
Fig. 6. Geotagged images with the longitude and latitude of Moskow |
How can we -architects, researchers and educators- make use of these new trends and the availability of so much city related information? A good example of using geo-tagged images from community photo collections is the research performed by Michael Goesele (http://www.gris.informatik.tu-darmstadt.de/~mgoesele/). His research is focused on acquiring digital models of reality for computer graphics and vision. Based on e.g. Flickr images high-quality geometry models can be generated. On the research website there are 3D models shown from e.g. a reconstruction of the Statue of Liberty by using images collected from Flickr. The model was automatically made by photogrammetric computation of many available pictures, taken from different points of view, taken by a large number of tourists.
A totally different example that shows interesting application for education is the innovative use of Wikipedia by professor Martha Groom (http://www.bothell.washington.edu/IAS/faculty/mgroom.xhtml). “Instead of letting her students rely on Wikipedia as a source, however, Groom has turned it into a destination for their classwork: in place of a term paper, her students were required to create Wikipedia entries.” (http://arstechnica.com/news.ars/post/20071030-prof-replaces-term-papers-with-wikipedia-contributions.html).
Similarly architects, researchers and educators in Architectural Design can turn Web 2.0 applications into innovative tools, platforms and sources. Especially group-work with students, focussing on urban developments, can benefit by new Web 2.0 trends. The combination of shared and exchanged urban analyses, design sketches and final designs, superimposed on the generally available ‘world context’ of Google Earth, can lead to new ways of interaction with each other’s ideas.
|
|
| Fig. 7. The potential of context information that is ordered in a global coordinate system makes it possible to have Shared-IN-Sight. These tools can be used throughout the design process and in education of context-related design in an iterative spiralling way |
|
|
| Fig. 8. Example of a simplified 3d-analysis superimposed on a map by using SketchUp and Google Earth. [8_sketchup and google earth.png] |

Conclusion
The structured content available through Web 2.0 applications can be used in the collection process in order to produce rich urban site information. The information can be used in different stages, from early site enquiries till final design presentations. The available techniques have changed dramatically and allow thinking about new methods and collaboration processes in design and design education.
After many years of research and several EAEA conferences, we as experts in architectural visual information exchange, should keep focussed on quality. At the same time we should be aware of the new techniques and approaches. We can integrate these new possibilities into our research and education (like the two people in the described examples did).
The eye in the EAEA logo becomes a searching eye. We do not anymore look through a narrow endoscope-pipe, but we look over a broadband panorama of information.
